

VegMachine – Looking at the ground from the sky
Wouldn’t it be nice see how your ground cover has changed on your place over the last 30 years without having to leave your desk? Satellites (Landsat) have been taking pictures of your back yard for thirty years. The good news is that now you can access these images too, on an easy to use website called VegMachine.
Veg Machine lets you look at ground cover of selected areas through time. To select the areas to observe cover changes you can either import files such as kml files, or you can draw your own area on the website map. At its most basic, you can look at maps of cover across your place for a selected date. Options include total ground cover, woody cover (persistent green), as well as decile cover which indicates whether the cover is above or below average compared to the historical record (Figure 1).
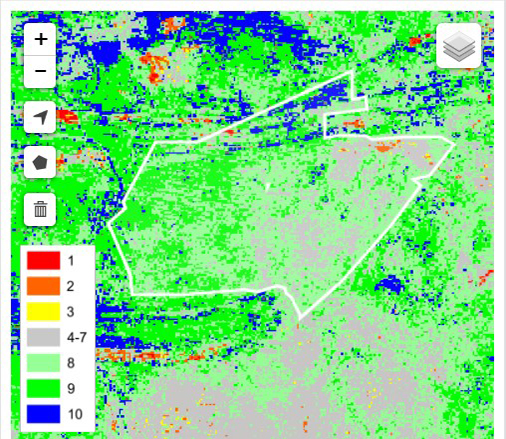
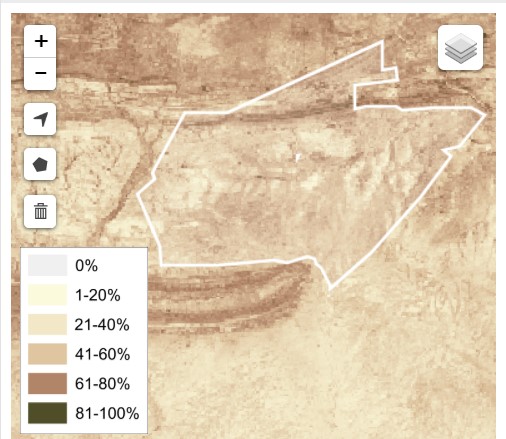
Figure 1: Example of VegMachine decile cover map which shows whether there is more (green to blue) or less (yellow to red) cover than average (left) and total ground cover (right) for Old Man Plains in the summer of 2017.
But the real strength of VegMachine is the summary of cover through time for different areas using the polygon comparison tool. To demonstrate I have compared the ground cover changes on Old Man Plains, the DPIR research station, to similar pastoral land around it (Figure 2). Everyone wants to know how they are doing compared to their neighbours!
The first thing you notice is that the ground cover varies a lot between the rarer very wet seasons and the usual desert climate. Ground cover usually tracked between 40 to 50%, but increased to 70% in the wet early 2000s and 2011-2012, and was lowest in the very dry year of 2008.
The next thing you notice is that at the beginning of the 1990s Old Man Plains had similar ground cover to the surrounding pastoral land. However, over time the ground cover on Old Man Plains and Pastoral land 1 increased twice as much through time as on Pastoral land 2 (Table 1). Old Man Plains has been stocked according to recommended carrying capacity by DPIR since 2004. We hoped that applying safe carrying capacity would lead to improved land condition, and the increased ground cover suggests it may have, but it took above average seasons in 2010 to 2012 to improve. The spread of buffel on Old Man Plains might also have contributed to increased ground cover.
Fires can cause sudden large reductions in average ground cover, as can be seen on Old Man Plains and on Pastoral land area 2 in 2002, and again on Pastoral land area 2 in 2011. The lower average ground cover following the 2002 fire carried through for 7 years until 200mm rainfall in November and December 2008 led to higher cover in 2009. The larger ground cover response on Old Man Plains in the beginning of 2009 followed partial destocking of Old Man Plains in 2008, which combined with the rotational grazing and spelling, may have maximised recovery.
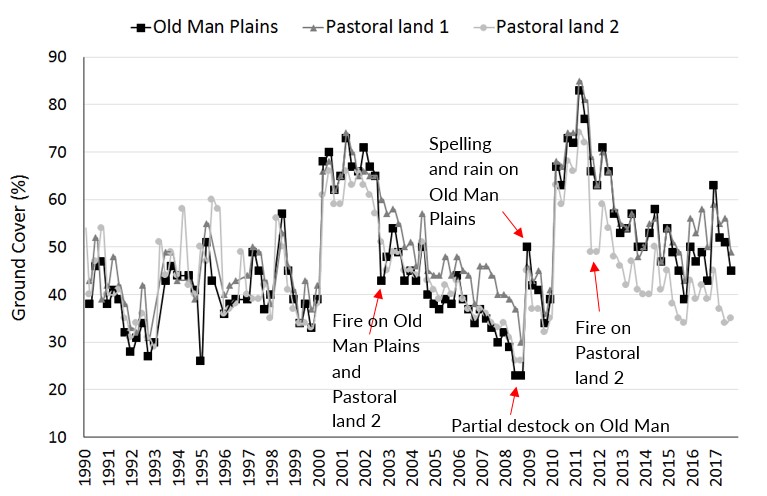
Figure 2: Change in ground cover through time downloaded from VegMachine on Old Man Plains and surrounding pastoral land.
Table 1: Average ground cover and change through time for the research station and surrounding areas.
| Old Man Plains | Pastoral land area 1 | Pastoral land area 2 | |
|---|---|---|---|
| First ten years 1990 to 1999 | 40% | 43% | 40% |
| Last ten years 2008 to 2017 | 52% | 55% | 44.5% |
| Change in cover | +12% | +12% | +4.5% |
You might want to compare individual paddocks, or similar land types to see how they are tracking through time on your place. Because seasons cause large changes in ground cover, comparing cover trends through time on different areas (e.g. near vs. far from water, grazed vs. ungrazed) can help to distinguish seasonal from management related trends. Knowing what has happened with seasons, fire and grazing management will help you to interpret the possible causes of ground cover changes in different areas. Is ground cover decreasing more through time on some areas? That could mean that stocking rates are too high, or fire frequency was higher. Is ground cover increasing more in some areas? That could suggest that management is allowing recovery of pastures.
To see some short example videos of how to use VegMachine click the following links.
- https://www.facebook.com/vegmachine/videos/2063416797269064/
- https://www.facebook.com/vegmachine/videos/2068441680099909/
Also, click on the help button on the VegMachine site to get an excellent easy to follow manual about how to use it.
To get a file of your station boundary to use in VegMachine email dale.jenner@nt.gov.au.
Have fun!
What’s the big deal about ground cover?
Ground cover protects the soil from erosion. It also reduces soil evaporation, which leaves more water in the soil for growing grass. Good cover gives your land the best chance to capture and keep the rain that falls, so you maximise the growth of your pastures.
Give feedback about this page.
Share this page:
URL copied!